The State of the Market report provides valuable information that will help you strategise the growth of your solar business.
Discover key insights into where there is unserviced demand as well as national and seasonal trends and movements in the market.

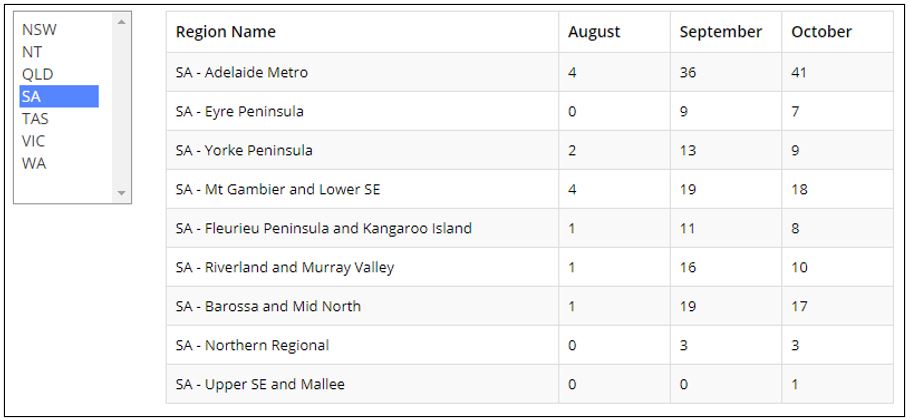
Underserviced Regions Report – Click here to view report
This report provides insight into the underserviced homeowner demand across the various regions in Australia. By targeting regions which are currently underserviced, you can build your installation resources and sales teams with confidence knowing that you can develop a strong sales pipeline by servicing the homeowner enquiries in each region. Information provided in the report:
-
- To see the maps of the various regions, please click here https://www.3quotes.com.au/business-resource-centre/maps-of-australia/
- Each column states the number of homeowners who didn’t receive three solar installer introductions within three days of their enquiry.
- The Lead types included in this report include – Solar, Solar and Energy Storage, Solar Expansion.
- We have provided the previous 3 months results so you can see the consistency of available underserviced leads.
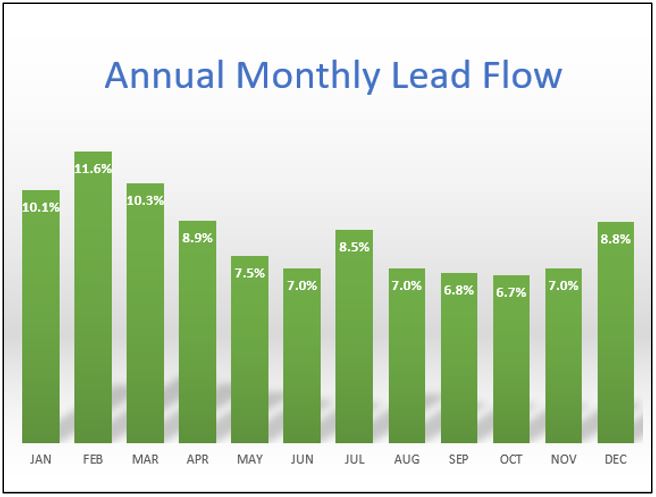
Seasonal Lead Flow
Each year we see a predictable flow of homeowner enquiries which appear to change with the seasons. The chart to the left shows the changes in lead flow during the year. Not surprisingly our enquiry rates trend to increase as we enter spring and the warmer and sunnier days and wains as we move back into winter. The market demand for Leads tends to remain fairly constant throughout the year.
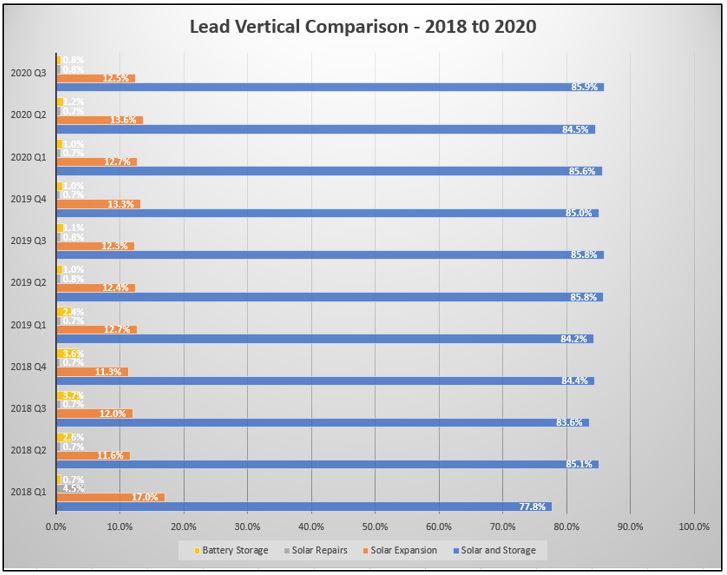
Lead Enquiry By Lead Type – 2018 to 2020
The chart to the right shows the trend in Lead enquiries from Jan 2018 to Sept 2020. We included this chart to provide insight into the changing trends in the market. We believe this data shows the following:
- Interest in solar expansion continues to slowly rise
- Interest in new solar adoption remains strong
- Enquiries for battery storage has remained low during the reporting period
Here is the source data for your reference.
2018 Q1 |
2018 Q2 |
2018 Q3 |
2018 Q4 |
2019 Q1 |
2019 Q2 |
2019 Q3 |
2019 Q4 |
2020 Q1 |
2020 Q2 |
2020 Q3 |
|
Solar and Storage |
77.8% |
85.1% |
83.6% |
84.4% |
84.2% |
85.8% |
85.8% |
85.0% |
85.6% |
84.5% |
85.9% |
Solar Expansion |
17.0% |
11.6% |
12.0% |
11.3% |
12.7% |
12.4% |
12.3% |
13.3% |
12.7% |
13.6% |
12.5% |
Solar Repairs |
4.5% |
0.7% |
0.7% |
0.7% |
0.7% |
0.8% |
0.8% |
0.7% |
0.7% |
0.7% |
0.8% |
Battery Storage |
0.7% |
2.6% |
3.7% |
3.6% |
2.4% |
1.0% |
1.1% |
1.0% |
1.0% |
1.2% |
0.8% |


